

Front-of-package labeling systems that categorize the nutritional quality of food may reduce the time it takes to process and understand labels, thus helping consumers identify healthier food choices.
In November 2018, the Spanish Ministry of Health officially announced the application of the Nutri-Score nutritional labelling system. In theory, it aims to allow consumers to easily judge the nutritional quality of the food they are about to purchase. However, in time, and in practice, several limitations and disadvantages have arisen, proving that it is an insufficient tool when it comes to meeting its objective.
Alejandro Monzó – Neolife Nutrition and Nursing Unit
The Nutri-Score is a label designed on the basis of scientific evidence
The term obesogenic environment was coined to describe a number of factors that in the modern-day environment contribute to body weight gain (1). Factors include technology that helps us avoid physical effort, low-cost foods with high energy density (usually industrial and processed foods), car dependence, product marketing, having very little time to prepare food at home, and a greater number of fast food restaurants, among others. According to the Ministry of Health, Spanish children see an average of 54 advertisements per day (2). Many of them are food products and not exactly healthy foods (products rich in sugar, salt, and saturated fats), which contributes to this aforementioned environment and their eating behavior.
As strategies in the control of overweight and obesity, it is essential to promote the intake of nutrient-rich foods at home and in schools. To support this effort, in 2021 the Ministry of Health will implement the “Nutri-Score”, a 5-color nutrition label, as the official system of nutritional information to be placed on the front of food packages (Figure 1). Within the public health framework, it seeks to meet several objectives (3): to allow consumers to judge, at a glance, the nutritional quality of food and thereby make healthier choices when making their purchase and encourage the food industry to improve the nutritional composition of the foods they produce.
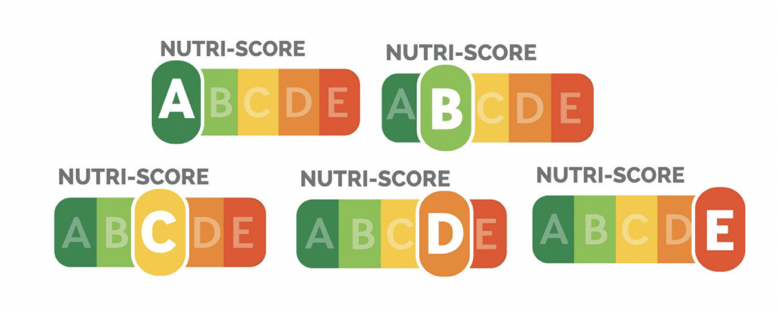
The Nutri-Score is a color label with letters that describe 5 kinds of nutritional quality, ranging from green (associated with the letter A) to dark orange/red (associated with the letter E) (3). This system assigns points based on the nutritional composition per 100 g or 100 ml of the product. The amount of nutrients deemed to be “unfavorable” or nutritionally critical (kilocalories, simple sugars, saturated fatty acids, and sodium) and the amount of nutrients or ingredients deemed to be “favorable” (proteins, dietary fiber, percentage of fruits, vegetables, legumes, oily fruits, olive oils, nuts and rapeseed) are taken into account and given a score (Figure 2.). This final score obtained will be within the range of -15 to +40, and the result is classified into 5 categories based on nutritional quality (A/B/C/D/E).

As far as the main advantages are concerned, the Nutri-Score label has been validated through solid scientific evidence, demonstrating its value in connection to health (4). It has proven its usefulness and effectiveness in the classification of the vast majority of the products that we find on the market, based on their nutritional quality (4). A study published in the Spanish journal, Revista Española de Nutrición Comunitaria, shows that the Nutri-Score may have positive effects, with a nutritional improvement of 9.3% in the average of the participants’ shopping carts (5). People will ultimately buy fewer products labelled D (orange) or E (red), and it will be up to the food industry to reformulate their food and products to include lower sugar and sodium, and improve fat quality. The authors further note that the Nutri-Score may become a common tool, applicable to the different Member States of the EU to improve the nutritional information provided to consumers. And so, many industrial and ultra-processed foods are going to have these kinds of scores, and it will be easy to identify them.
However, several authors and experts are aware that the system is not perfect, and it has been proposed that adjustments should be made to correct these limitations (4). One of the disadvantages is the absence of additives, ingredients, and the degree of processing of the product in the proposed calculation. On the other hand, when we apply this labelling system, olive oil is classified with the letter D and a diet or artificially sweetened soft drink with the letter B. At first glance, the comparison gives us the impression that the soft drink is healthier than olive oil, a fat that has shown great health benefits (6, 7).
The Nutri-Score takes calories per 100 g into account as part of its calculations. For this reason, olive oil gets a D, and a diet soda gets a B. This label is effective when it comes to comparing products of the same category (such as two different brands of juice), but a comparison between two different categories (chocolates and breakfast cereals) draws erroneous conclusions; the consumer will make all kinds of comparisons creating confusion, even if they are from the same food group (Figure 3) (8,9).

Therefore, the biggest limitation of the Nutri-Score is that it is a report card that grades food products mainly based on nutrients and calories. In this regard, the saturated fat contained in an egg is not the same as the one we find in a croissant, the sugar we find in a piece of fruit is not the same as the one we find in an industrial juice, or the calories in a handful of nuts are not the same as those contained in a bag of chips (6, 8, 9). In short, it’s more important to know where those calories are coming from and always opt for quality raw materials, and fresh, local, and seasonal produce. Therefore, according to the World Health Organization (WHO), the food industry can play a significant role in promoting healthy diets by doing the following(10):
- Reducing the fat, sugar, and salt content of processed foods
- Ensuring that healthy and nutritious choices are available and affordable to all consumers
- Restricting marketing of foods high in sugars, salt, and fats, especially those foods aimed at children and teenagers
- Ensuring the availability of healthy food choices and supporting regular physical activity practice in the workplace
Finally, excess energy is commonplace in our world. When researching the relationship between food availability and dietary intake, the obesogenic environment is evident, which, coupled with sedentary lifestyles, are factors that lead to overweight, obesity and associated comorbidities. The prevention of these conditions lies in restricting the consumption of these products through government policies, school programs, and home education, and stimulating the consumption of nutrient-rich healthy foods and the practice of physical exercise.
At Neolife, we develop an action plan with our patients to help them adopt healthy nutritional and lifestyle habits. In their personalized nutritional counseling, the patient acquires an optimal nutritional education that helps them make healthy choices in their visits to the supermarket and correctly interpret nutritional labelling. This way, it is possible to educate the patient from a knowledge standpoint and, ultimately, achieve health and quality of life, while enjoying food, always in the context of an active life.
BIBLIOGRAPHY
(1) David L. Katz, Rachel S. C. Friedman & Sean C. Lucan. (2015). “Nutrición Médica”. 3rd Ed. Wolters Kluwer Health, S.A.
(2) Manera, M. (2011). “Obesidad: ¿vivimos en un entorno obesogénico?” [Obesity: Do we live in an obesogenic environment?]. Article in Eroski Consumer.
URL:https://www.consumer.es/alimentacion/obesidad-vivimos-en-un-entorno-obesogenico.html
(3) Galan, P. et al. (2019). “Nutri-Score: el logotipo frontal de información nutricional útil para la salud pública de España que se apoya sobre bases científicas” [Nutri-Score: the front-of-package nutritional information label useful for public health in Spain that is based on scientific evidence]. Nutr. Hosp. Vol. 36(5):1213-1222.
URL:https://scielo.isciii.es/pdf/nh/v36n5/1699-5198-nh-36-05-01213.pdf
(4) Salas-Salvadó, J. & Babio, N. (2020). “¿Por qué hay que apoyar la implantación del etiquetado frontal de los envases Nutri-Score en España?” [Why should we support the implementation of the front-of-package Nutri-Score label in Spain?]. IISPV, Hospital Universitari Sant Joan REUS and Universitat Rovira i Virgili.
URL:https://www.nutricio.urv.cat/media/upload/domain_1498/imatges/llibres/nutriescore2020_Juliol.pdf
(5) Galan, P. et al. (2017). “El logotipo nutricional NutriScore en los envases de los alimentos puede ser una herramienta útil para los consumidores españoles” [The Nutri-Score nutritional label on food packaging can be a useful tool for Spanish consumers]. Rev. Esp. Nutr. Comunitaria, 23(2).
(6) Revenga Frauca, J. (2020). “Nutri-Score: ¿un sistema para blanquear ultraprocesados?” [Nutri-Score: a system to identify ultra-processed foods?]. El Comidista. Diario El País.
URL: https://elcomidista.elpais.com/elcomidista/2020/07/27/articulo/1595861417_286035.html
(7) López Pevida, N. (2019). “Nutri-score, ¿las críticas tienen fundamento?” [Nutri-score, is the criticism grounded?]. Article in Eroski Consumer.
URL: https://www.consumer.es/alimentacion/criticas-nutri-score-tienen-fundamento.html
(8) Carceller, R. (2018). “¿La coca-cola zero es más sana que el aceite de oliva? Errores del nuevo NutriScore” [Is Coca-Cola Zero Sugar healthier than olive oil? Problems with the new Nutri-Score]. Diario La Vanguardia.
(9) Mateo, M. (2018). “Sanidad nos ofrece un <<semáforo de colores>> para elegir lo que comemos” [The Health Ministry is offering us a ‘traffic light’ to help us choose what we eat]. Oxocarbenio, scientific paper.
(10) WHO. (2020). “Obesity and overweight: how can overweight and obesity be reduced”. World Health Organization.
URL: https://www.who.int/news-room/fact-sheets/detail/obesity-and-overweight